States Investing Most in Schools (2026 Ranking)
The States Investing Most in Modern Learning Environments (2026 Ranking)
A complete ranking of all 50 states scored on bond activity, per-pupil spending, investment momentum, and facilities prioritization
American schools are in the middle of a generational investment moment.
In 2025, U.S. public schools issued approximately $82 billion in municipal bonds — a 42% jump from 2024 and the highest level in over a decade. Voters approved more than $116 billion in school bonds in 2024 alone [1] and over 900 additional bond measures are already under discussion for 2026 [2]. One major consistency across the United States is that its communities want better schools.
Research consistently shows that investing in school infrastructure can boost learning outcomes for students, as well as boost local property values [3, 4]. Working with the top school furniture companies is one effective way to make these improvements.
But not all states are participating equally. Some are moving fast, passing large bonds, increasing per-pupil investment, and actively modernizing aging buildings. Others are stalled, maintaining crumbling infrastructure on flat budgets, watching their facilities fall further behind the needs of contemporary teaching and learning.
That gap matters for students. Research consistently shows that the physical environment affects how students learn, how teachers teach, and how engaged both groups are in the classroom [4].
The average U.S. school building is now 49 years old [3]. This ranking exists to make visible which states are allocating resources to improve these vital spaces.
| $82B K–12 bonds issued in 2025 [1] | 42% Year-over-year increase [1] |
| $116B Voter-approved in 2024 alone [1] | 49 yrs Average school building age [5] |
Ranking Methodology:
Scores are based on four weighted components:
| Component | Weight |
|---|---|
| Facilities Modernization Index | 30% |
| Capital Outlay per Pupil | 25% |
| Bond Financing Index | 25% |
| Growth Trajectory | 20% |
Why these four components?
Facility investment is a system. A state can spend a lot per pupil but never approve bonds for construction. It can pass bonds but direct them toward athletics rather than instructional spaces. It can modernize buildings while enrollment is shrinking, or fail to keep up while enrollment is exploding. The composite score captures all of these dimensions together.
Scores are normalized (0–100) and represent relative positioning across states.
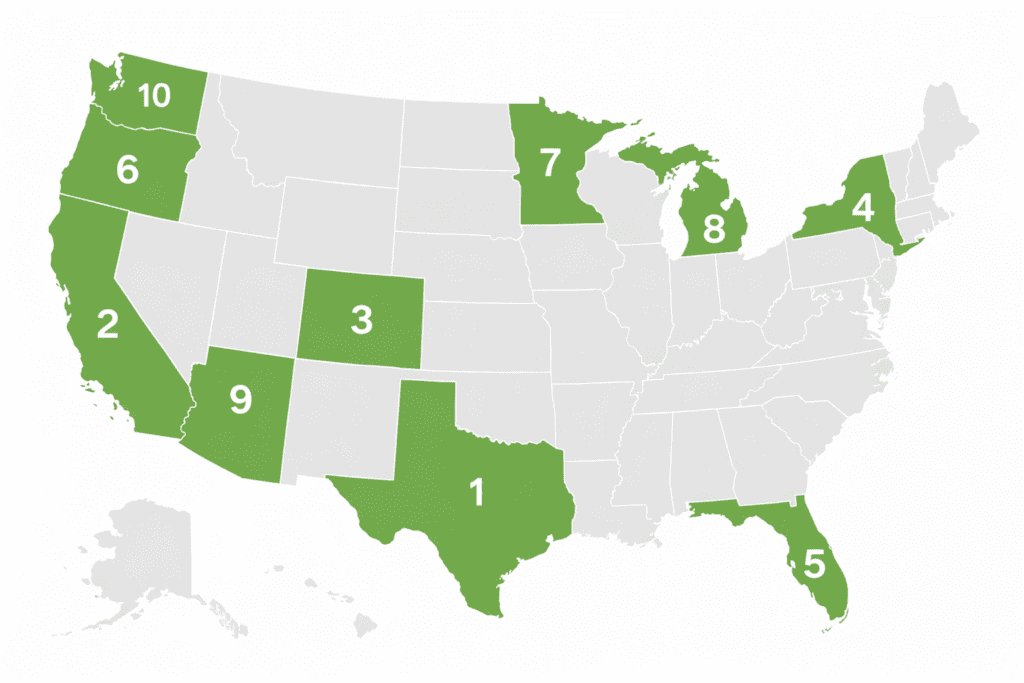
The Top 10:
These states are setting the national pace with high bond activity, strong per-pupil investment, and active modernization programs.
| Rank | State | Score |
|---|---|---|
| 1 | Texas | 96 |
| 2 | California | 94 |
| 3 | Colorado | 91 |
| 4 | New York | 89 |
| 5 | Florida | 87 |
| 6 | Washington | 85 |
| 7 | Minnesota | 83 |
| 8 | Michigan | 82 |
| 9 | Arizona | 81 |
| 10 | Oregon | 80 |
See the complete list below
| Rank | State | Score |
|---|---|---|
| 1 | Texas | 96 |
| 2 | California | 94 |
| 3 | Colorado | 91 |
| 4 | New York | 89 |
| 5 | Florida | 87 |
| 6 | Washington | 85 |
| 7 | Minnesota | 83 |
| 8 | Michigan | 82 |
| 9 | Arizona | 81 |
| 10 | Oregon | 80 |
| 11 | Illinois | 78 |
| 12 | North Carolina | 77 |
| 13 | Georgia | 75 |
| 14 | Virginia | 74 |
| 15 | Maryland | 73 |
| 16 | New Jersey | 72 |
| 17 | Massachusetts | 71 |
| 18 | Tennessee | 70 |
| 19 | Indiana | 69 |
| 20 | Wisconsin | 68 |
| 21 | Pennsylvania | 67 |
| 22 | Ohio | 66 |
| 23 | Missouri | 64 |
| 24 | South Carolina | 63 |
| 25 | Kentucky | 62 |
| 26 | Alabama | 60 |
| 27 | Utah | 59 |
| 28 | Iowa | 58 |
| 29 | Kansas | 57 |
| 30 | Nebraska | 56 |
| 31 | Nevada | 54 |
| 32 | Arkansas | 53 |
| 33 | Oklahoma | 52 |
| 34 | New Mexico | 51 |
| 35 | Idaho | 50 |
| 36 | Montana | 48 |
| 37 | Wyoming | 47 |
| 38 | South Dakota | 46 |
| 39 | North Dakota | 45 |
| 40 | Alaska | 44 |
| 41 | West Virginia | 42 |
| 42 | Mississippi | 41 |
| 43 | Louisiana | 39 |
| 44 | Maine | 38 |
| 45 | New Hampshire | 37 |
| 46 | Vermont | 36 |
| 47 | Rhode Island | 35 |
| 48 | Delaware | 34 |
| 49 | Hawaii | 33 |
| 50 | Connecticut | 32 |
The 2026 Pipeline Is the Opportunity Window
With over 900 bond measures under discussion for 2026, and election timing requirements in key states creating specific windows (California’s bond elections align with June 2 and November 3, 2026), now is the moment when districts are making planning decisions that will shape facilities for the next decade.
Districts that approach bond-funded projects strategically, with educator-led design, full lifecycle planning, and built-in measurement, will see meaningfully better outcomes than those that treat bonds simply as construction budgets.
Meteor Education partners with districts to design and implement learning environments that maximize budget impact and deliver real outcomes — with educator-led design, 240+ manufacturer partners and in-house project management. District administrators can connect with local experts to create custom, modern learning environments that support their education goals.
Sources:
[1] MeteorEducation, “The $82 Billion Opportunity,” February 12, 2026.
[2] SchoolBond.news, January 2026.
[4] Aimee Levitt, “Does Capital Spending on Schools Improve Education?” September 26, 2023.
[5] National Center for Education Statistics “Fast Facts,” 2024.
[6] ASCD, “Tending to Learning Environments,” December 1, 2022.
[8] Petra Sucher, “The Researcher Recap: Quarter 1,” March 31, 2025.
[9] The Bond Buyer, “Bond Election Results,” November 6, 2024.
[10] MSRB, “MSRB Statistical Summaries and Reports.”
[11] LISC, “Charter School Bond Issuance by State.”
Ready to transform your existing space into a dynamic learning hub that engages every student? Contact the learning environment experts at Meteor Education today to start a conversation and bring your vision to life.
Get in touch
Find Your Local Studio
Meteor Education partners with schools to create collaborative spaces that accelerate engagement and empower educators.