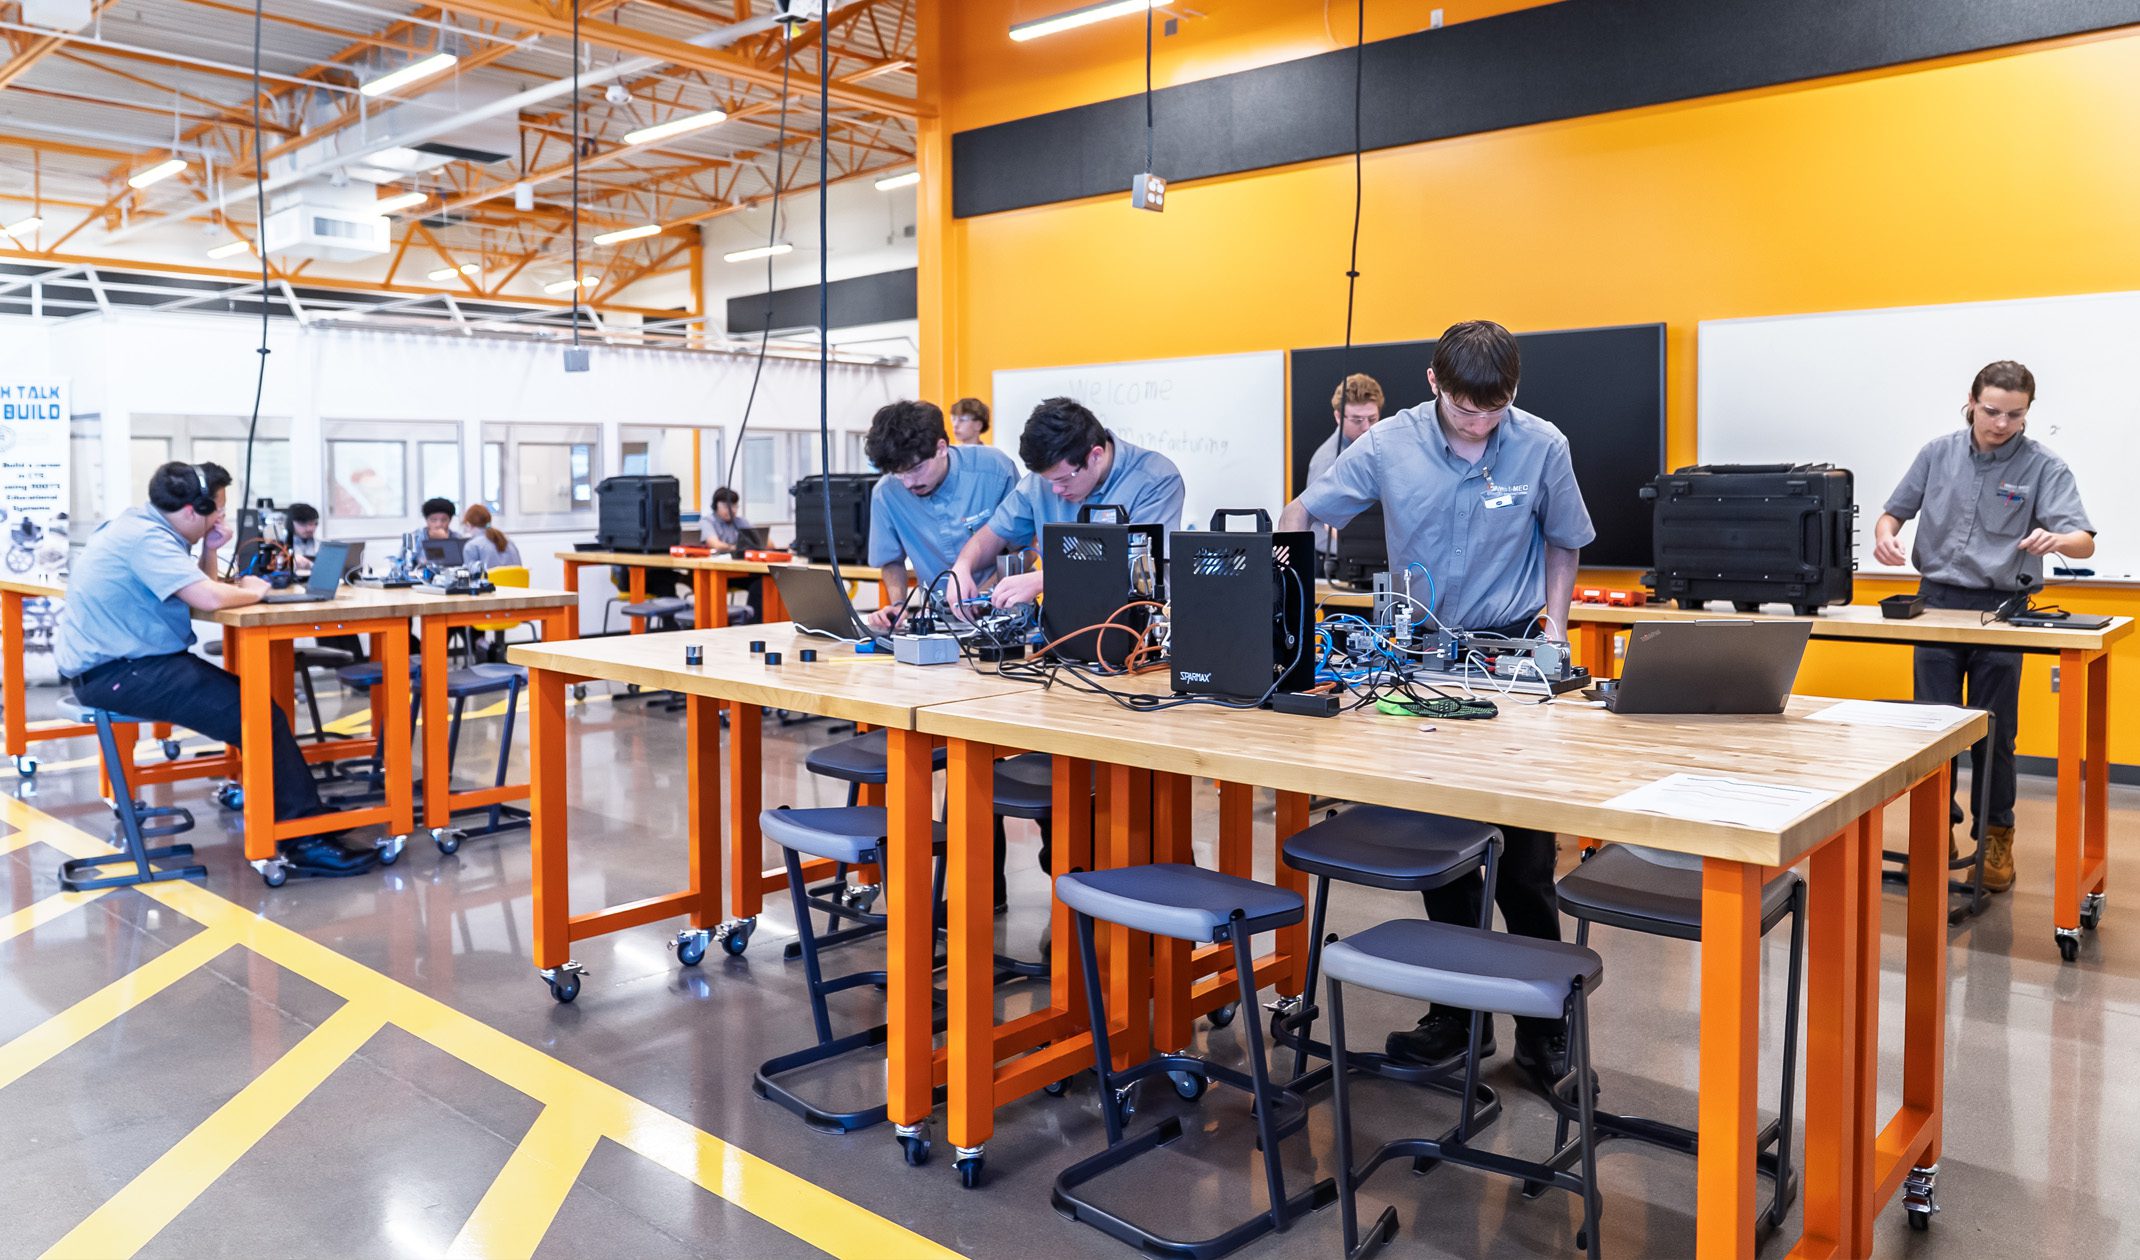
2026 K-12 Learning Environment Vendor Selection Report: What Districts Prioritize
This report compiles publicly available data on K-12 capital funding, facility condition, and district-stated priorities, and examines what those figures indicate about how districts evaluate learning environment partners.
A note on scope. No comprehensive public dataset ranks the criteria districts use to select learning environment vendors, and anyone presenting one should be asked where it came from. What does exist is strong data on the conditions districts are buying under: available capital, building condition, stated needs, and how districts assess them. This report works from that evidence.
1. The Funding Picture
Local bond measures are the primary funding mechanism for K-12 capital projects, and bond volume has been at historically high levels.
| Year | Voter-Approved Value (at election) | Passage Rate | Note |
|---|---|---|---|
| 2023 | About $82.5 billion | Not reported | Baseline year |
| 2024 | More than $116 billion | About 75% | Roughly 2,300 measures decided; a 39% increase over 2023 |
| 2025 | About $69.2 billion | 75% | About $91 billion tracked; roughly $22.7 billion failed |
| Spring 2026 | About $2 billion (May 5) | 54% (May 5) | April 7 elections passed 120 of 150 measures, about 80% |
Source: SchoolBondFinder / The Amos Group, reported via School Construction News and EdWeek Market Brief [1][2]. Figures represent dollars approved by voters at the ballot, not bonds issued. Issuance typically follows approval over a multi-year window. Figures are approximate and revised as results are certified.
Two things follow from this table.
First, the money is real and it is large, but it is not evenly distributed in time. The 2024 spike reflects a presidential election year with higher turnout. Passage rates in off-cycle 2026 elections have been more variable, with May 5 results at 54% lagging the historical national trend.
Second, approved dollars are not spent dollars. Bond funds are drawn down across a multi-year window, which means the capital approved in the 2024 and 2025 cycles largely converts to purchasing activity in the years ahead rather than immediately.
Bond activity is also geographically concentrated. In 2025, SchoolBondFinder recorded the highest total bond amounts in Texas ($18.4 billion), California ($6.1 billion), Ohio ($3.5 billion), Washington ($3.4 billion), and Pennsylvania ($3.0 billion) [1]. Capital availability varies significantly by state, which means a district’s planning environment depends heavily on where it sits.
| State | 2025 Bond Total |
|---|---|
| Texas | $18.4 billion |
| California | $6.1 billion |
| Ohio | $3.5 billion |
| Washington | $3.4 billion |
| Pennsylvania | $3.0 billion |
Source: SchoolBondFinder, reported via School Construction News [1].
2. The Condition Picture
Demand is driven by building condition, and the federal picture is well documented. The most recent federal survey of school facilities, conducted by the U.S. Government Accountability Office, surveyed districts nationwide on the condition of their buildings and their facility priorities [3].
| Finding | Figure |
|---|---|
| Districts needing to update or replace multiple building systems or features | About 54% of public school districts |
| Districts needing HVAC updates in at least half their schools | About 41%, representing roughly 36,000 schools |
| Districts that conducted a facilities condition assessment in the past 10 years | About two-thirds |
| Estimated annual national funding gap for PK-12 school facilities | About $85 billion per year |
| Public school buildings significantly renovated or replaced since original construction | Fewer than half; fewer than one-third improved since 2010 |
Sources: U.S. Government Accountability Office, GAO-20-494 (survey fielded 2019) [3]; State of Our Schools 2025 [4]; ASCE 2025 Infrastructure Report Card [5].
The assessment figure is the one most often overlooked. If roughly two-thirds of districts have conducted a facilities condition assessment in the past decade, roughly one-third would benefit from one. Without a documented baseline, districts are scoping capital projects without a clear picture of what they already have, which affects scope accuracy, reuse decisions, and the ability to demonstrate change after a project is complete.
Meteor Education evaluates existing learning environments to identify immediate needs. A Current Environment Assessment provides that documented baseline, covering how spaces are used, what is underperforming, and which existing furniture can be reused.
3. What Districts Say They Prioritize
The GAO survey asked districts directly about facility priorities. The three most frequently cited were improving security, expanding or upgrading technology, and addressing health hazards [3].
Learning environment and furniture upgrades did not appear at the top of that list. That is worth stating plainly rather than working around. When districts are asked about facilities in the abstract, building systems and safety dominate, because a failing HVAC system is an emergency and a poorly configured classroom is not.
Program demand signals
Separately, an EdWeek Research Center survey of 472 K-12 educators with a connection to CTE, fielded September 18 to October 27, 2025, provides directional data on where program growth is expected [6].
| Survey Finding | Result |
|---|---|
| Report CTE offerings have increased over the past five years | 61% |
| Report student interest in CTE has increased over the past five years | 71% |
| Rate their own CTE program quality an A | 23% (47% B, 27% C) |
| Cite additional funding for courses or pathways as a major improvement need | 56% |
| Cite additional resources for facilities or equipment as a major improvement need | 49% |
| Expect work-based learning opportunities to increase in the next five years | 77% |
| Expect student access to industry-recognized credentials to increase | 75% |
Source: EdWeek Research Center survey, n=472 (114 district leaders, 144 school leaders, 101 teachers, 113 other roles) [6].
Note the gap between demand and self-assessed quality. Interest and offerings are up, but only about one in four respondents graded their own program an A, and facilities and equipment resources ranked second among stated improvement needs. That combination describes a market that is expanding faster than it is being equipped. For planning considerations in these spaces, see the superintendent’s guide to future-proofing CTE for workforce demand.
Partner selection criteria
On vendor selection specifically, an independent 2025 industry survey found that 73% of stakeholders rate the physical learning environment as extremely or very important to student learning, and 86% ranked industry-aligned learning environments that engage students among their top five criteria when selecting a partner [7].
4. What the Data Indicates for Vendor Selection
Reading the funding, condition, and priority data together produces four conclusions that districts can act on.
| Indication | What It Means in Practice |
|---|---|
| Capital is available but time-bound | Bond funds are approved in concentrated cycles and spent across multi-year windows. Districts that identify furniture and equipment scope early in that window have a genuine choice. Districts that address it at the end inherit whatever remains. |
| Furniture is rarely the trigger | Learning environment scope typically rides along with a project driven by building systems, capacity, or safety. It needs to be protected as a line item from the outset because it will not defend itself. |
| Assessment is inconsistent | Roughly a third of districts do not have a recent facilities condition assessment and could benefit from one. A partner that begins with a structured assessment is filling a documented gap rather than adding a step. Meteor Education begins engagements with a Current Environment Assessment for this reason. |
| Program demand is outpacing equipping | Where programs are expanding, self-assessed quality is not keeping pace, and facilities and equipment resources are a top-cited need. |
5. The Recurring Finding: Furniture Budgets Are Set Too Late
Across every dataset reviewed here, the same structural pattern appears. Capital is committed at the start of a bond cycle, project scope is driven by building systems and safety, and furniture and equipment is resolved at the end against whatever remains.
Do not wait to build the furniture budget until the last minute. It should be accounted for at the very beginning of the project.
Districts that establish the FF&E line early get consistent standards across multiple sites and phases, a real choice among approaches rather than a default set by leftover funds, and time to pilot before committing a full program. Late planning produces isolated single-site purchases and mismatched inventory across buildings.
The stakes extend well past the project. Spaces and furniture funded through a bond will serve many generations of students and teachers, and districts are often working against a long horizon before the next capital cycle comes around. That is a strong reason to protect the FF&E line rather than treat it as flexible: the choices made during one bond determine what learning environments look like for years afterward.
Meteor Education partners with districts on FF&E planning for capital improvement and bond-funded programs, helping teams establish classroom furniture budgets earlier in the project lifecycle.
6. Implications by Stakeholder
| Stakeholder | What the Data Suggests |
|---|---|
| District leaders | Establish the furniture and equipment line at bond passage rather than after construction pricing settles. If no recent facilities condition assessment exists, commission one before scoping. Set district-wide standards rather than deciding site by site. |
| Architects and design firms | FF&E is consistently treated as a residual line. Elevating it to a primary planning item at schematic design prevents the late-stage compromise where design intent meets a leftover furniture budget. |
| Facilities and operations | Assessment data has value beyond scoping. A documented baseline supports reuse decisions, warranty and lifecycle planning, and post-occupancy evaluation. |
Conclusion
The data does not support a tidy ranked list of what districts want from a vendor. What it supports is more useful: a clear picture of the conditions districts are buying under.
Capital is available in concentrated, time-bound cycles. Building condition drives project scope, and furniture rides along rather than leading. Many districts would benefit from a current assessment of what they already have. Program demand in growth areas is outpacing the resources available to equip it.
Districts that plan against those conditions, by setting the furniture line early, assessing before scoping, and standardizing across sites, get better outcomes than districts that address learning environment scope at the end of a project.
Meteor Education supports districts across the full project lifecycle, from Current Environment Assessment and early budget through Collaborative Design, installation, Environment Orientation, and Impact Report measurement.
District leaders and design partners can speak with a Meteor Education expert to plan learning environment scope against an upcoming bond or capital cycle.
Ready to transform your existing space into a dynamic learning hub that engages every student? Contact the K-12 learning environment experts at Meteor Education today to start a conversation and bring your vision to life.
Sources
[1] SchoolBondFinder / The Amos Group bond tracking data, reported via School Construction News, 2026.
[2] EdWeek Market Brief, “School Bond Measures: How Can Education Companies Capitalize on Voter-Approved Projects?” June 2025.
[3] U.S. Government Accountability Office. “K-12 Education: School Districts Frequently Identified Multiple Building Systems Needing Updates or Replacement.” GAO-20-494, June 2020.
[4] 21st Century School Fund, International WELL Building Institute, and National Council on School Facilities. State of Our Schools 2025.
[5] American Society of Civil Engineers. 2025 Infrastructure Report Card, Schools category.
[6] EdWeek Research Center survey of K-12 educators with a CTE connection, n=472, fielded September 18 to October 27, 2025.
[7] Independent 2025 industry survey.
Get in touch
Find Your Local Studio
Meteor Education partners with schools to create collaborative spaces that accelerate engagement and empower educators.