Impact Report
Justifying investments in learning spaces is tough. You need data, not promises. Meteor Education’s Impact Report provides the tangible insights you need to prove ROI and secure future funding.
EVIDENCE-BASED
Real Data from Real Classrooms
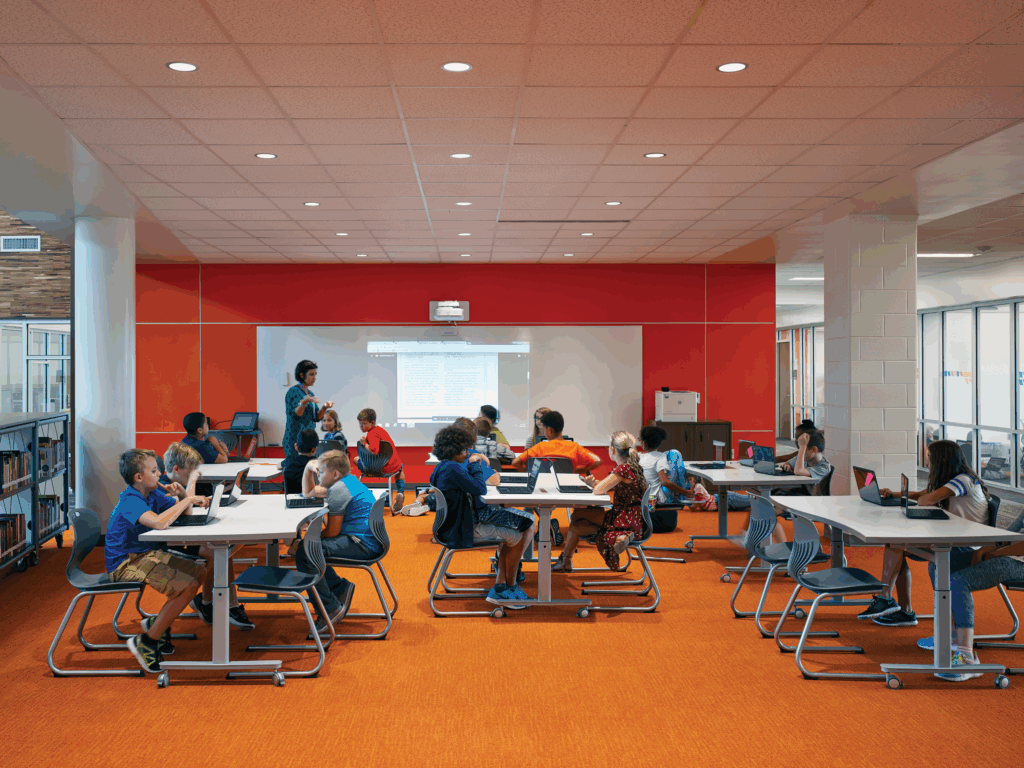
Our educators observe classrooms and capture data on student collaboration, teacher-student interactions, and space utilization. These findings reveal patterns and trends that demonstrate how effectively your environments support teaching and learning.
OUTCOMES
Measurable Gains
Across Metrics
Based on data from our work at Yuba City and Guilford County schools.

Group Work
Classrooms arranged in group setups increased from 59% to 85%, enabling more collaborative learning.

Student Voice
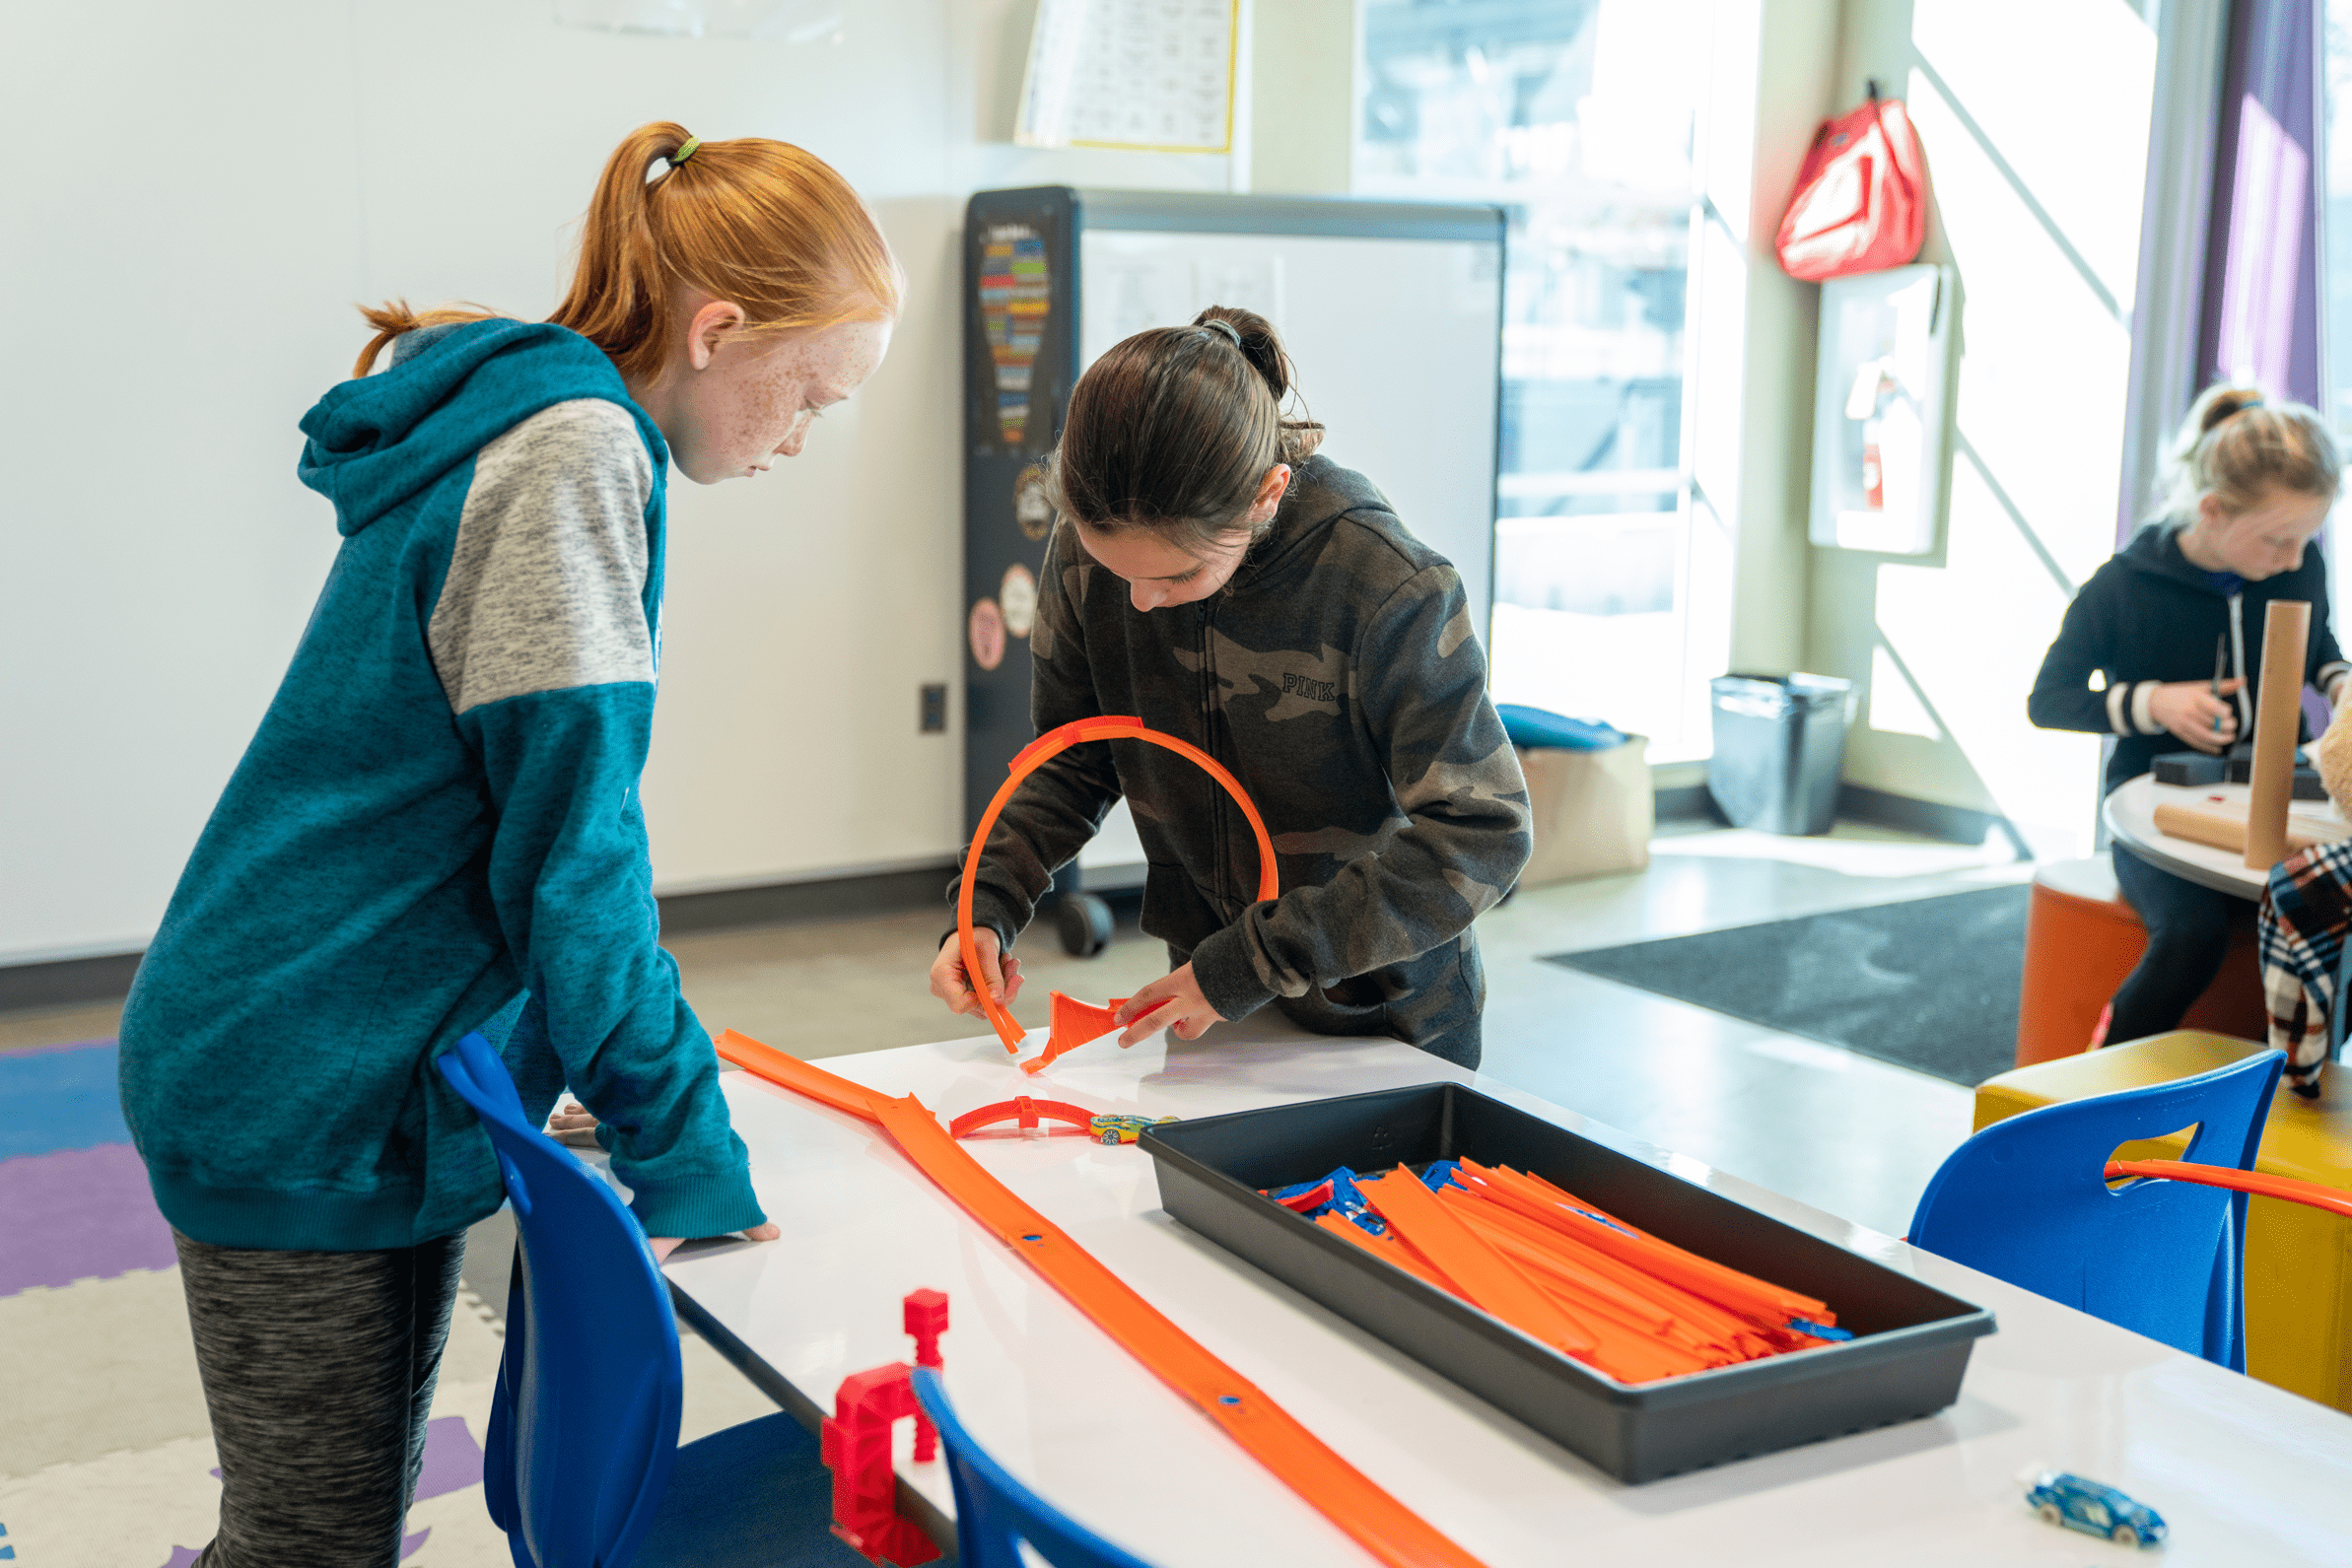
Student-led discussions and participation increased from 46% to 78%.

Student Space
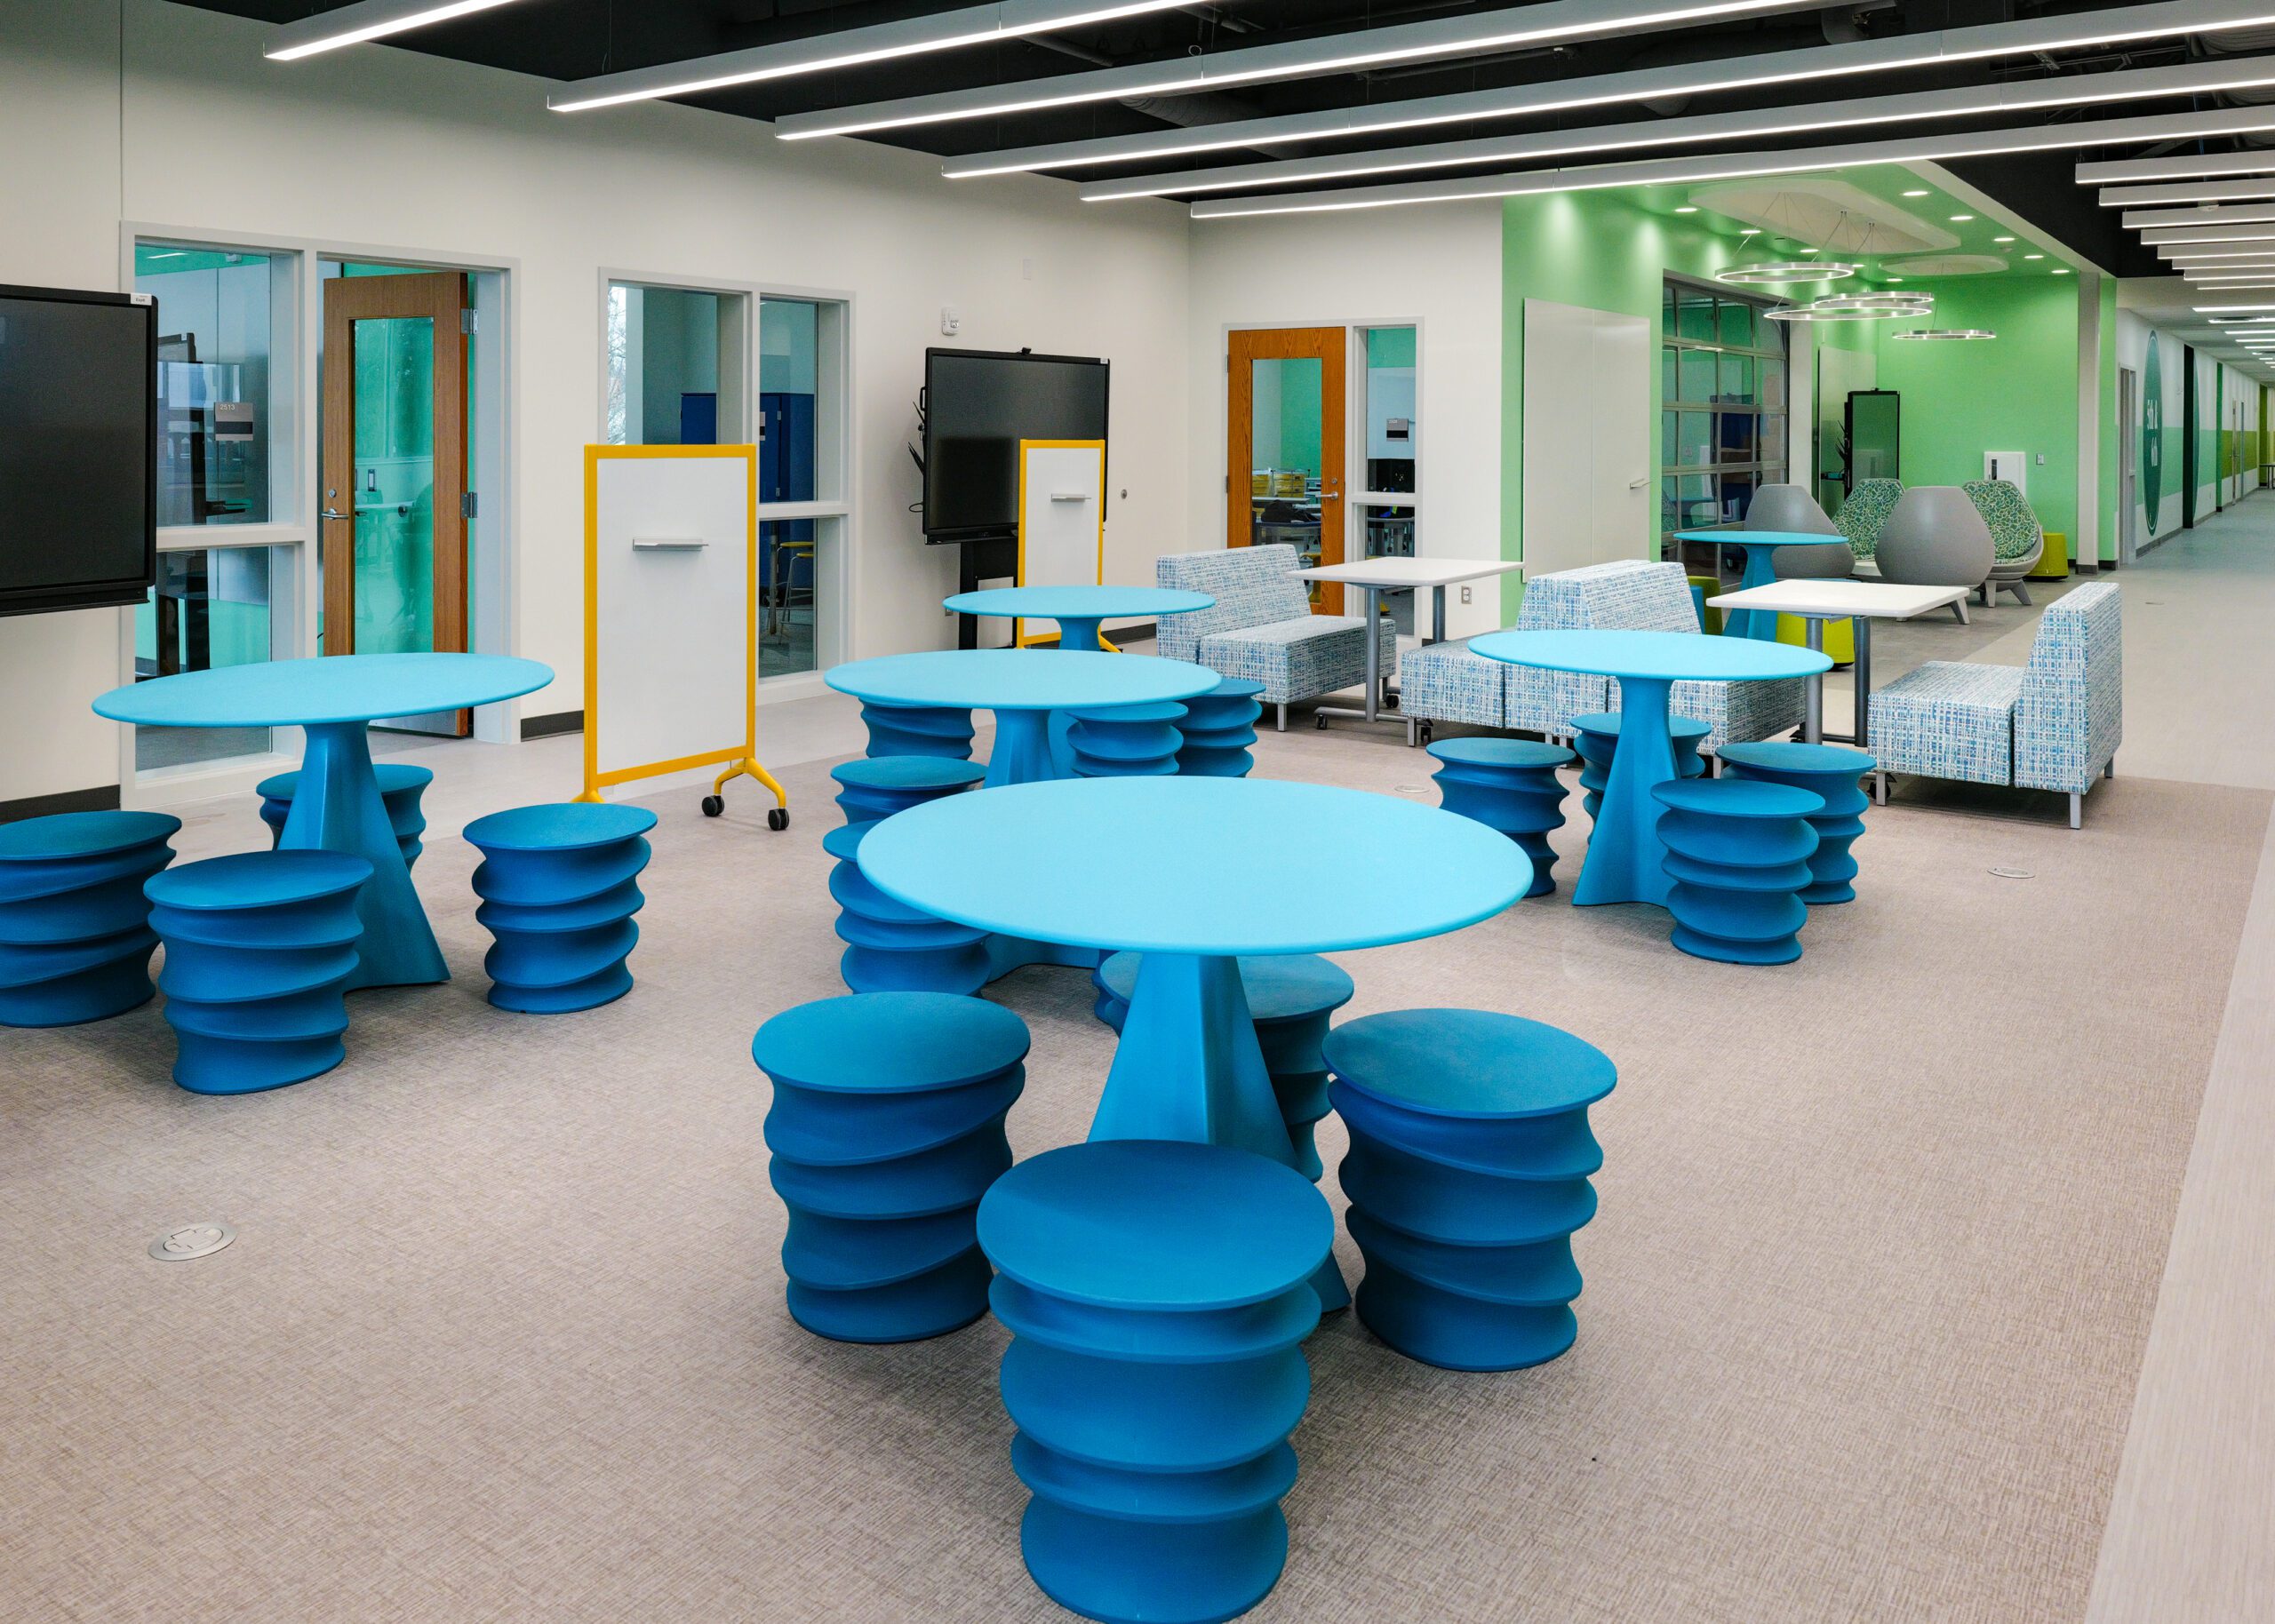
Classroom layouts now dedicate 27% more space to flexible, student-centered learning by thoughtfully minimizing fixed teacher areas.
Student Autonomy
Student-led seating choices doubled to 24%, empowering students to choose seating that meets their needs.
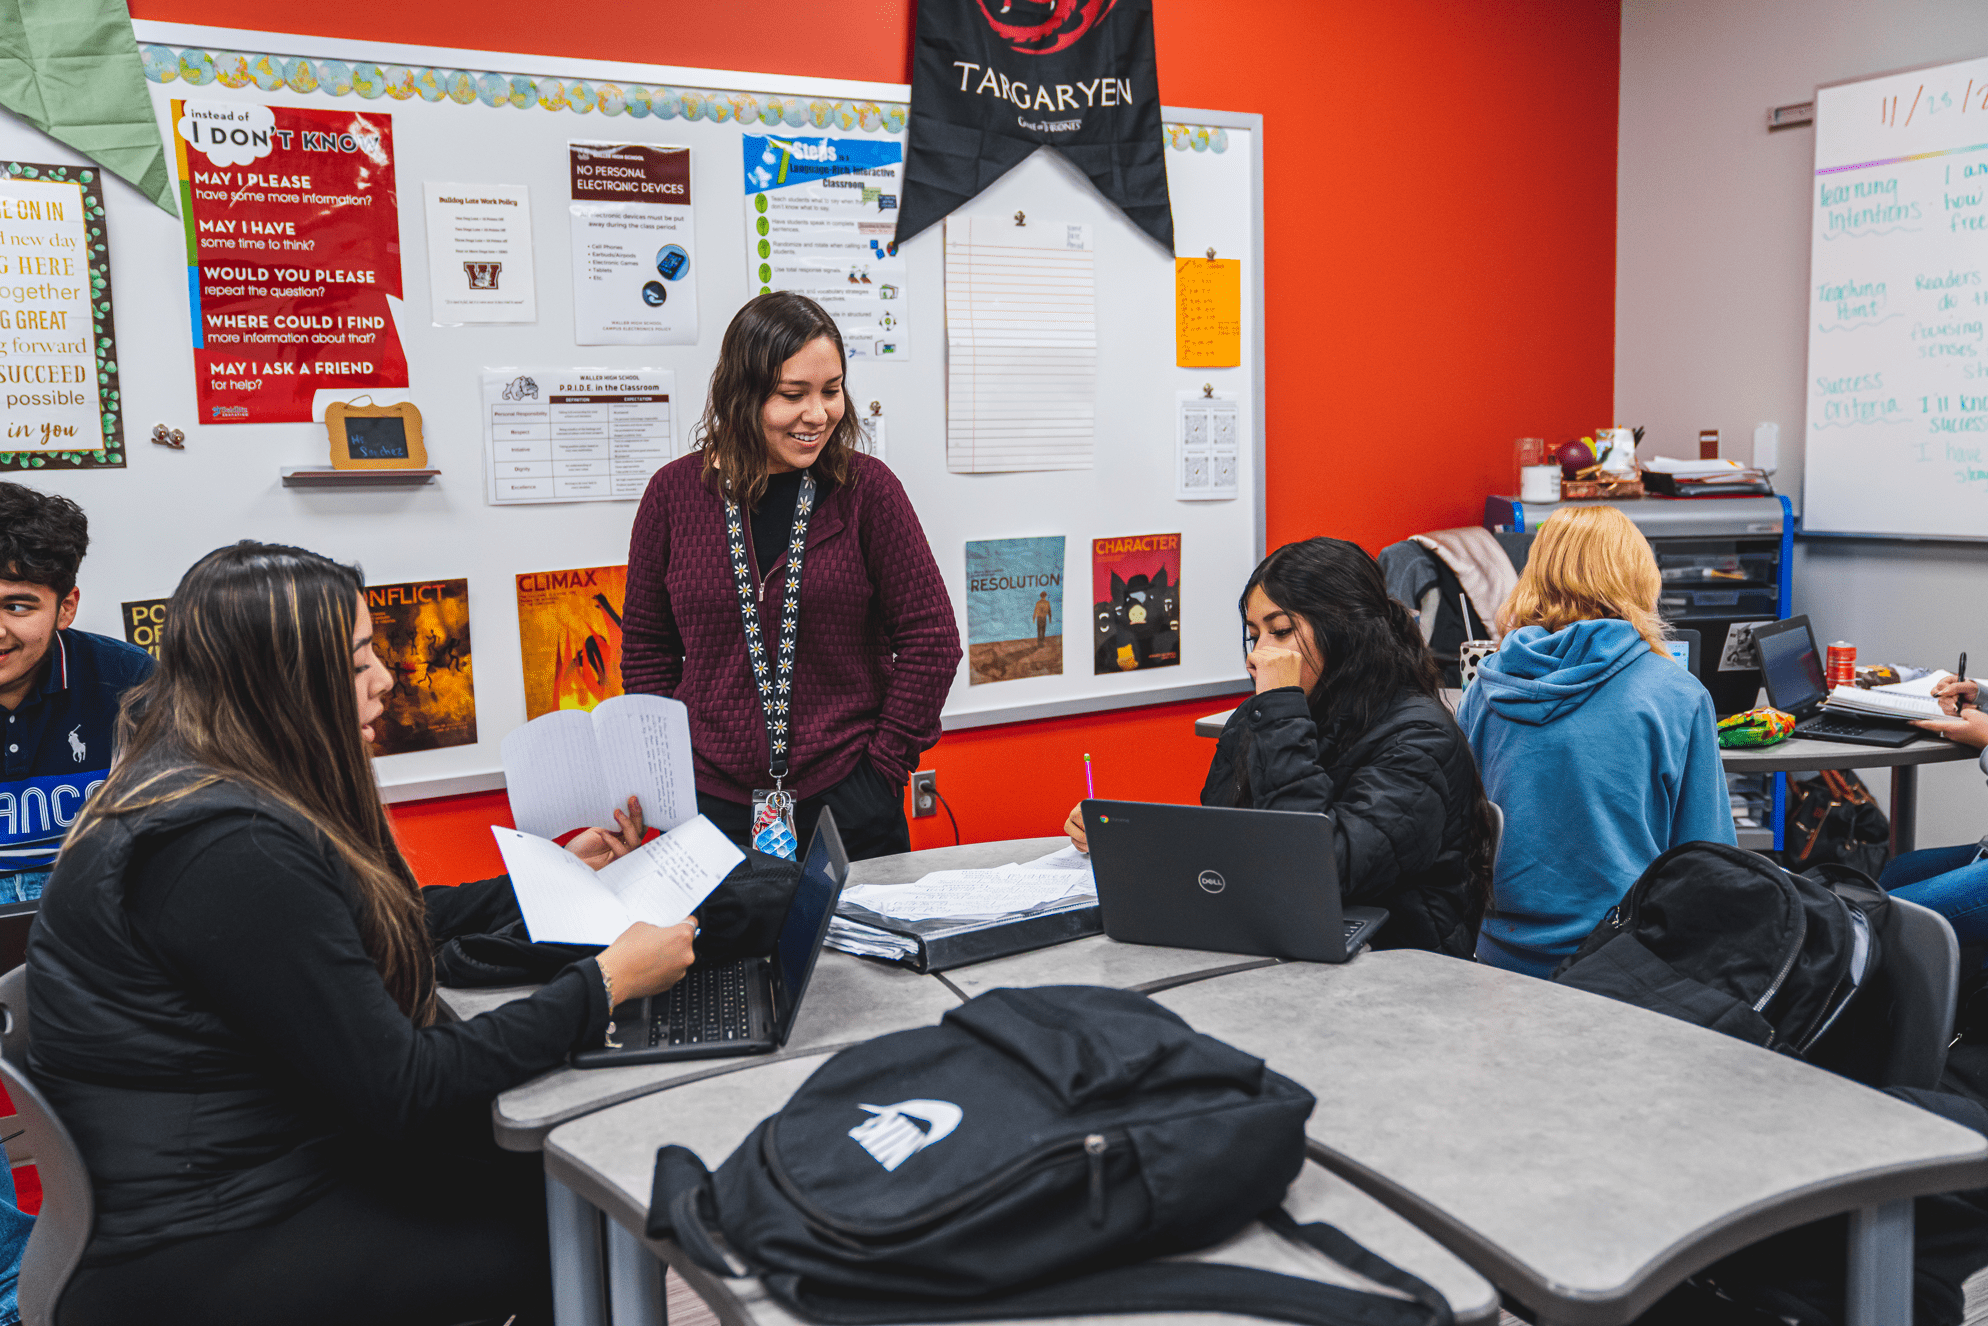
Caring Proximity
Teachers are more active throughout the classroom, with hands-on support for students increasing from 50% to 73%.
Body Language
Positive body language increased from 45% to 76%, demonstrating an improvement in student-teacher interaction.
Put Your Data to Work
Your Impact Report is a powerful tool for advancing your educational mission. The evidence gathered opens doors to funding opportunities and builds stakeholder confidence in your vision.
Secure Funding
Present compelling data that demonstrates clear return on investment and strengthens your funding requests.
Improve Student Outcomes
Use data-driven strategies that show how your learning spaces impact education and engagement.
Build Community Trust
Show parents and stakeholders the measurable impact of their support in creating more engaging learning environments.
How It Works
Through a structured, two-part process, we capture real classroom activity before and after installation to highlight measurable shifts in engagement.
This first phase captures how teachers and students interact within your existing learning spaces before any changes are made. Our expert educators conduct structured classroom walkthroughs to observe authentic interactions. In the past two years, we’ve observed 1,005 classrooms, impacting 1,100+ teachers and 17,000+ students.
The second phase repeats the observation process about 8 weeks after your new environment installation and Environment Orientation, capturing changes in usage, engagement, and learning dynamics compared to your baseline data. In the past two years, we’ve conducted comparative observations in 150+ classrooms with 155+ teachers and 2,700+ students—revealing measurable improvements and clearly demonstrating the real impact of learning space investment.
We conduct brief, non-intrusive classroom walkthroughs to observe real interactions. Data is collected only when both teachers and students are present, ensuring authenticity. Visual evidence is added with permission.
Before the walkthrough, administrators coordinate scheduling, notify teachers, and provide classroom schedules with a minimum of 10 minutes for each visit. After the walkthrough, administrators meet with Meteor Education to review data for a minimum of 30 minutes. Total support time for each school is a maximum of 2.5 hours.
By documenting outcomes transparently, the report provides evidence that supports funding requests and grant applications with clear return on investment.
We can visit up to 30 classrooms during a school day, with each classroom visit lasting a minimum of 10 minutes. Reports are ready within 7-10 days, followed by a presentation meeting. The Comparative Impact Report is conducted approximately 8 weeks after Environment Orientation.
Baseline and Comparative Impact Reports are presented during a meeting where findings are discussed with clients. An electronic report copy is provided, with printed copies available on request.
Frequently Asked Questions
Learn more about how our unique Impact Report process helps you prove the ROI of your new learning environments.
Get in touch
Find Your Local Studio
Meteor Education partners with schools to create collaborative spaces that accelerate engagement and empower educators.